
Nimisha Antony
Data Analyst
Experienced Data Analyst & Power BI Developer with 6+ years of expertise in Power BI, SQL, Python, and Excel, delivering actionable data insights through analysis, visualization, and dashboards.
Skills & Tools
- Python
- MySQL
- Code Jupyter
- Power BIPower BI
- ExcelExcel
- TableauTableau
- Data AnalyticsData Analytics
- Google AnalyticsGoogle Analytics
- DAXDAX
- Jira
About Me
I am a passionate and results-driven Data Analyst with over 6 years of professional experience specializing in transforming raw data into meaningful business insights. I hold a Postgraduate degree (M.Sc.) in Mathematics and a Bachelor's degree in Mathematics with Computer Science, along with a Data Analytics certification.
My core expertise lies in Power BI, where I design interactive dashboards and reports that enable stakeholders to make informed, data-driven decisions. I am proficient in SQL, Python, Microsoft Excel, and Tableau, with hands-on experience in data extraction, data cleaning, data transformation, data modeling, and data visualization.
Throughout my career, I have worked with data from multiple sources, ensuring its accuracy, consistency, and quality before transforming it into actionable insights. I develop interactive dashboards using KPIs, charts, and visualizations to identify trends, monitor business performance, and support strategic decision-making. I am committed to delivering reliable, insight-driven solutions that improve operational efficiency and drive business growth.
Core Skills
Power BI
DAX
SQL
Python
Microsoft Excel
Tableau
Google Analytics
Data Cleaning & Data Transformation
Data Analysis & Business Insights
Interactive Dashboard Creation
Data Modeling & Reporting
I am passionate about leveraging data to solve business problems, improve operational efficiency, and deliver impactful analytical solutions. I continuously enhance my technical skills and enjoy working in collaborative environments where data drives innovation and business growth.
Work Experience
Jan 2025-Jan 2026
Data Analyst
Art Technology and Software
Designed and developed interactive Power BI and Tableau dashboards to transform raw data into meaningful business insights for stakeholders.
Built Employee KPI Performance Dashboards to monitor productivity, attendance, target achievement, and overall employee performance using key performance indicators.
Created comprehensive HR Dashboards to analyze employee headcount, attrition, recruitment, gender diversity, department-wise performance, and workforce trends.
Developed Finance Dashboards to track revenue, expenses, profit margins, budgets, cash flow, and financial KPIs, enabling data-driven financial decision-making.
Performed Exploratory Data Analysis (EDA) to identify trends, patterns, anomalies, and business opportunities using statistical analysis and data visualization techniques.
Conducted data cleaning, transformation, and data wrangling using Power Query, SQL, and Excel to ensure high-quality, reliable, and accurate datasets.
Collaborated with cross-functional teams and business stakeholders to gather requirements, understand business objectives, and deliver customized reporting solutions.
Wrote SQL queries to extract, join, filter, and analyze large datasets from multiple data sources, ensuring efficient data retrieval and reporting.
Automated recurring reports and optimized dashboard performance, significantly reducing manual effort while improving reporting accuracy and efficiency.
Delivered actionable insights and strategic recommendations through data analysis and visualization, helping business teams improve operational performance and make informed decisions.
Feb 2024-May 2024
Data Analyst
PurpleTalk
Analyzed sales and customer support data to identify trends, measure business performance, and provide actionable insights for strategic decision-making.
Utilized the Magento platform to collect, validate, and manage product, sales, and customer data, ensuring data accuracy and consistency.
Designed and developed interactive dashboards and customized reports using Power BI and Excel to visualize key business metrics and KPIs.
Monitored sales performance by tracking revenue, order volume, customer behavior, conversion rates, and product performance.
Conducted data cleaning, transformation, and validation to maintain high-quality datasets for reporting and analysis.
Mar 2022-Feb 2024
Data Analyst
Atirath Gaming Technology Pvt Ltd
Analyzed large-scale gaming datasets to identify player behavior, engagement trends, and business opportunities using data-driven techniques.
Developed interactive dashboards and reports in Power BI to monitor key gaming metrics, including player retention, engagement, monetization, and revenue.
Performed Exploratory Data Analysis (EDA) to uncover gameplay patterns, user segmentation, and performance trends that supported strategic decision-making.
Built predictive data models to forecast player retention, churn, and user engagement, enabling proactive business strategies.
Designed and tracked key performance indicators (KPIs) to measure game performance, player activity, and monetization effectiveness.
Collaborated with game developers, product managers, marketing teams, and business stakeholders to deliver actionable insights and optimize game performance.
Cleaned, transformed, and validated large datasets using SQL, Excel, and Power Query to ensure data accuracy and reporting reliability.
Automated recurring reports and optimized reporting workflows, reducing manual effort and improving operational efficiency.
Presented analytical findings through compelling data visualizations and business reports, enabling stakeholders to make informed, data-driven decisions.
Contributed to improving player experience, increasing engagement, and supporting revenue growth by translating complex data into strategic recommendations.
Aug 2019- Feb 2022
Data Analyst
The Red And Black
Analyzed large-scale gaming datasets to uncover player behavior, gameplay trends, and monetization opportunities, enabling data-driven business decisions.
Education
2016-2018
MSc Mathematics
MG University
2013-2016
BSc Mathematics
MG University
Selected Work
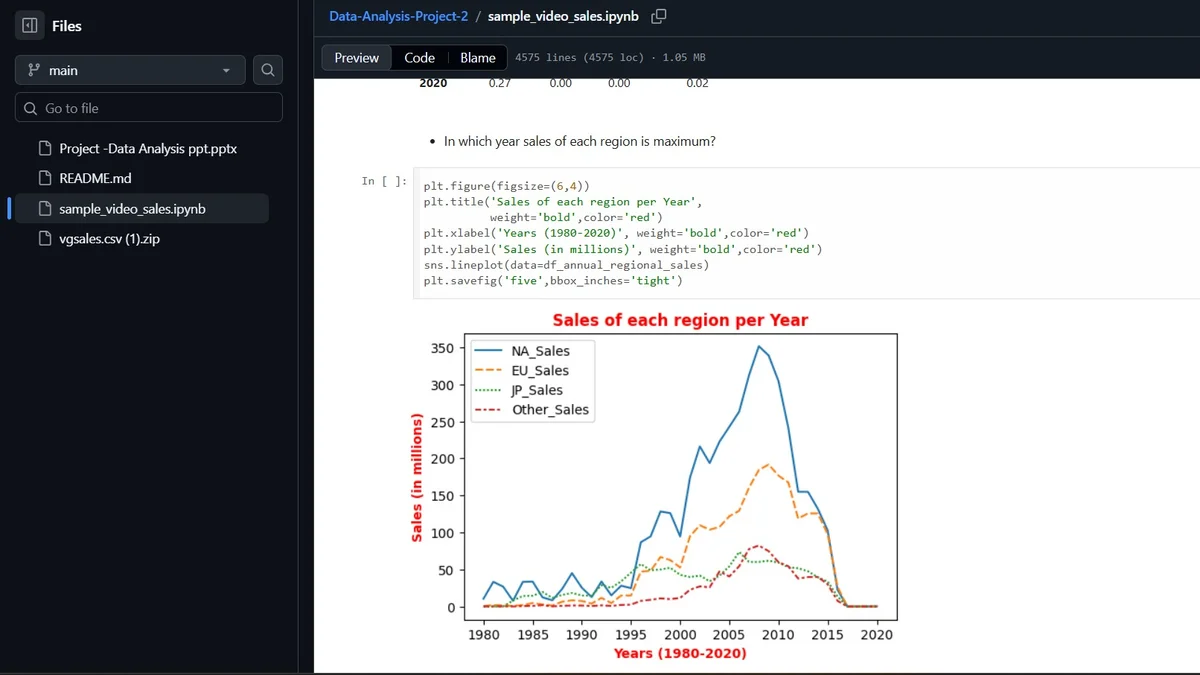
Data Analysis On Video Game Sales
This project focuses on analyzing the sales performance of more than 15,000 video games across different regions using Python. The dataset was collected from Kaggle and contains game title, platform, genre, publisher, release year, regional sales, and global sales. The primary objective was to identify sales trends, compare regional market performance, and understand the factors influencing worldwide game sales.The analysis was performed using Pandas for data cleaning and manipulation, NumPy for numerical computations, and Matplotlib and Seaborn for data visualization. EDA was conducted to examine top-selling games, leading publishers, popular gaming platforms, genre-wise performance, yearly sales trends, and regional sales distribution across North America, Europe, Japan. T
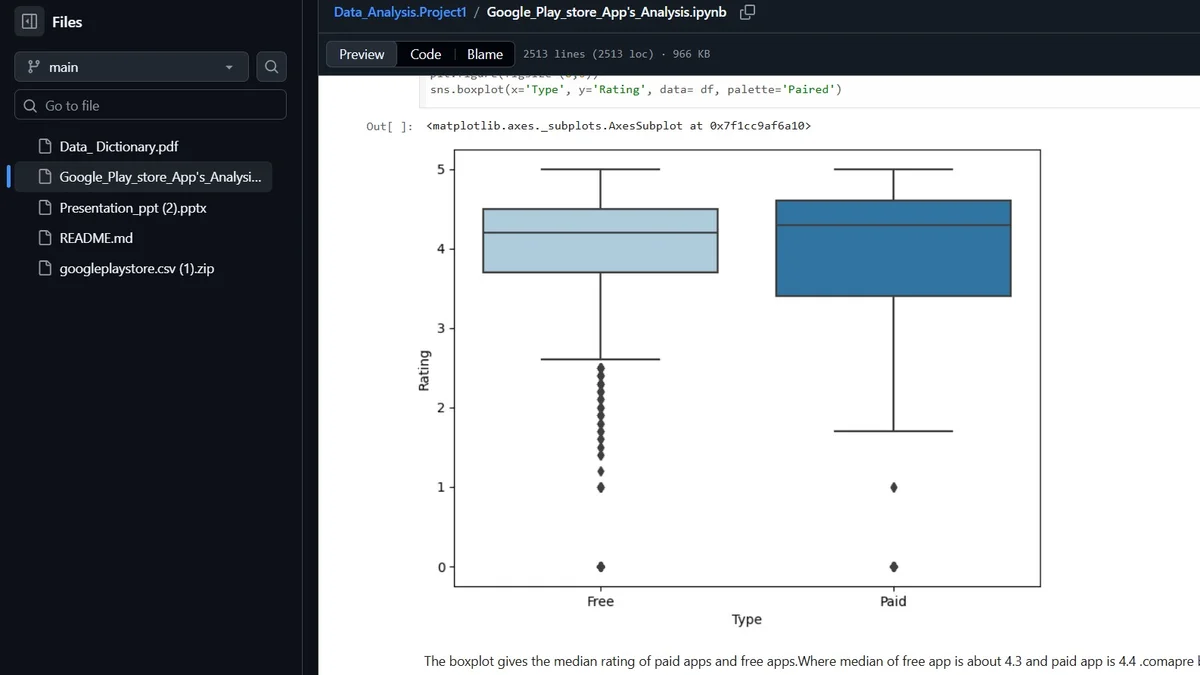
Data Analysis Of Google Play Store Appps
This project analyzes over 10,000 Google Play Store applications to identify the key factors that influence app ratings and predict which apps are most likely to achieve high user ratings. The dataset was collected from Kaggle and includes important attributes such as app name, category, price, type, size, genres, ratings, reviews, installs, content rating, Android version, current version, and last updated date.
The project involved data cleaning, preprocessing, exploratory data analysis (EDA), and visualization to uncover patterns in app performance. Insights were generated by analyzing relationships between app ratings, installs, reviews, categories, pricing models, and other features. The findings help identify high-performing applications and provide data-driven recommendations for app promotion and business decision-making while demonstrating strong skills in data analysis, visualization, and insight generation using Python.
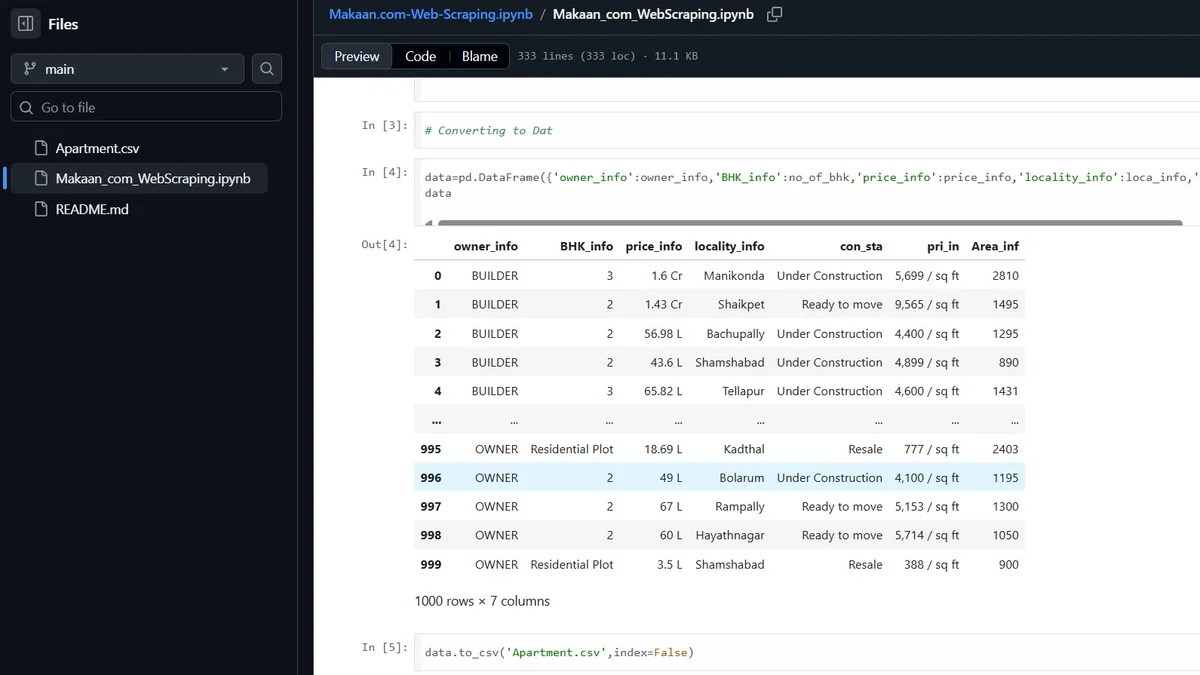
Data Colleaction Using Web-Scraping Technology
This project involves web scraping and analyzing real estate data from Makaan.com to gain insights into the Hyderabad property market. Using Python, data from 50 web pages was extracted, resulting in a dataset of approximately 1,000 apartment listings. The collected information includes owner details, number of BHKs, property price, area (in square feet), construction status, location, and price per square foot.The project was developed using Requests for sending HTTP requests, BeautifulSoup (bs4) for extracting website data, Time for handling request intervals, and Pandas for data processing and analysis. The scraped data was cleaned, structured, and stored in CSV format for further analysis.
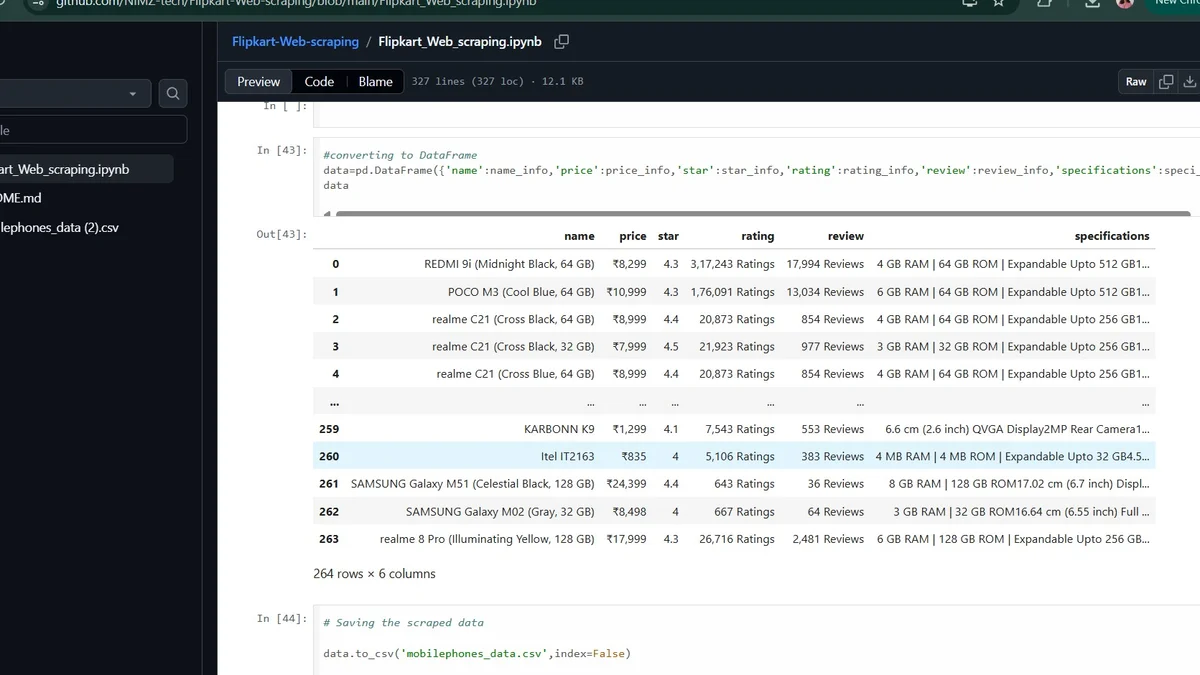
Flipkart.com_Web-scraping
This project focuses on web scraping mobile phone listings from the Flipkart e-commerce platform using Python. The objective was to collect and organize product information for market analysis and comparison. Data was extracted from multiple search result pages and stored in a structured CSV file for further analysis. The project was developed using Requests for sending HTTP requests, BeautifulSoup for parsing HTML content, Pandas for data processing and storage, Time for managing request intervals, and clear_output for monitoring the scraping process. The collected dataset includes mobile phone names, prices, customer ratings, review counts, product specifications, and star ratings. The scraped data was cleaned and structured to support exploratory data analysis, price comparisons, and product trend analysis.
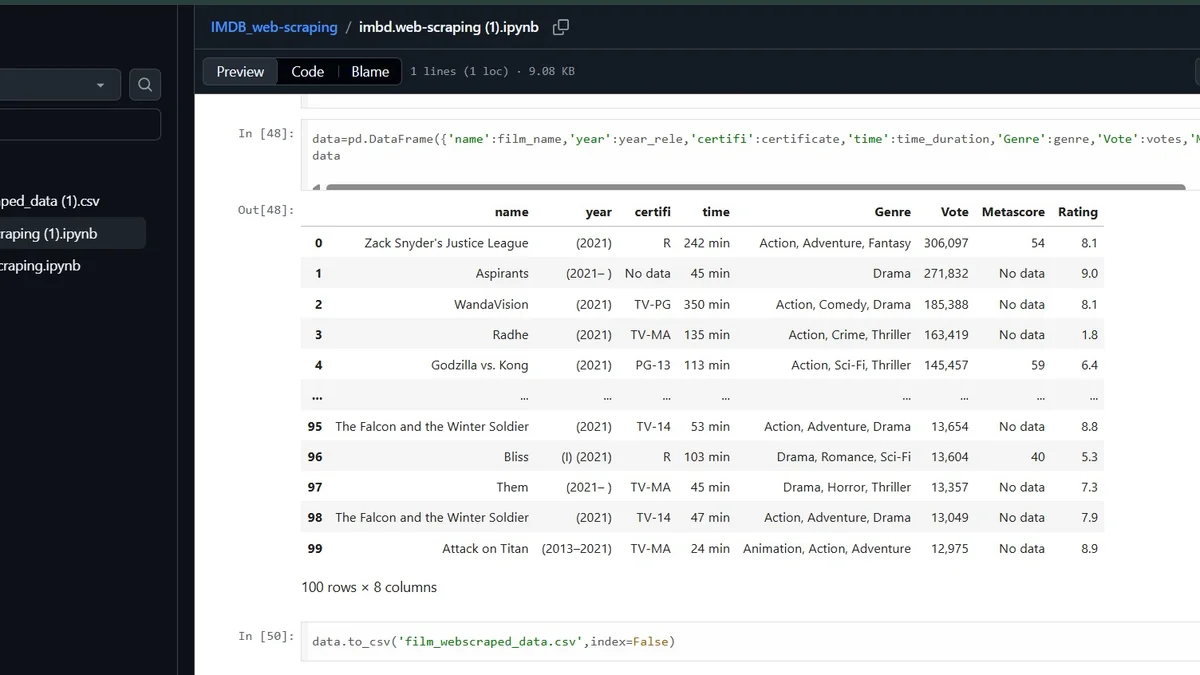
Imdb.com_webscraping
This project involves web scraping movie information from IMDb using Python to build a structured dataset for analysis. The data was collected from IMDb's list of the most popular movies released in 2021, sorted by the number of user votes. The extracted dataset includes movie title, release year, IMDb rating, genre, vote count, certification, runtime, and Metascore.The project was developed using Requests for sending HTTP requests, BeautifulSoup for parsing HTML content, Pandas for data processing and storage, and Time for managing request intervals during scraping. The collected data was cleaned, organized, and exported to a CSV file for further analysis.